Temperature Lekari (Telldus 135)
The statistics were last updated Monday, 2 February 2026 at 18:35,
at which time 'Telldus-FT007TH' had been up for 115 seconds since last measurement.
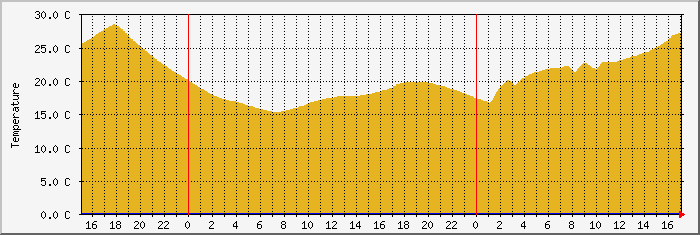
`Daily' Graph (5 Minute Average)

|
Max |
Average |
Current |
| + |
0.0 C |
0.0 C |
0.0 C |
| - |
20.1 C |
16.0 C |
12.9 C |
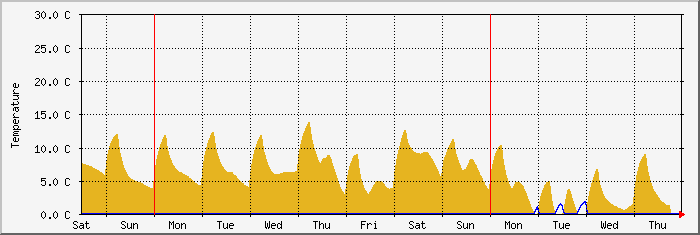
`Weekly' Graph (30 Minute Average)

|
Max |
Average |
Current |
| + |
3.4 C |
0.1 C |
0.0 C |
| - |
20.1 C |
8.4 C |
12.7 C |
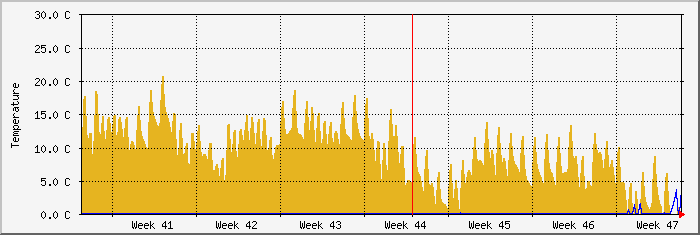
`Monthly' Graph (2 Hour Average)

|
Max |
Average |
Current |
| + |
12.0 C |
1.4 C |
0.0 C |
| - |
19.5 C |
5.0 C |
12.5 C |
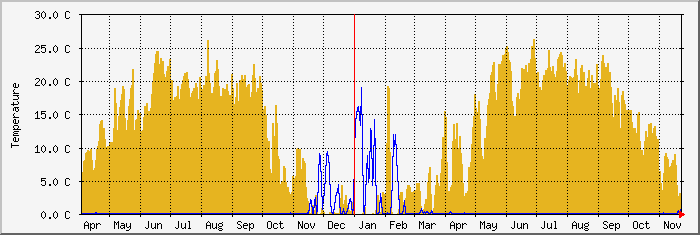
`Yearly' Graph (1 Day Average)

|
Max |
Average |
Current |
| + |
28.1 C |
11.5 C |
0.0 C |
| - |
16.2 C |
0.6 C |
16.3 C |


